The fixes for everything below live in the companion piece: How to make your website faster without buying anything.
The three that feed ranking
Core Web Vitals are a set of standardised measurements Google uses to quantify real-world user experience on a webpage. Introduced in 2020, became a confirmed Google Search ranking signal in 2021. Three metrics:
| Metric | What it measures | Good threshold |
|---|---|---|
| LCP | Loading performance | Under 2.5 s |
| INP | Interactivity | Under 200 ms |
| CLS | Visual stability | Under 0.1 |
The three that don’t (but are useful anyway)
The others covered below — TTFB, FCP, TBT — are supporting metrics. They don’t affect rankings directly but they’re diagnostically useful: they tell you why your Core Web Vitals are poor.
The timeline: when each metric is measured
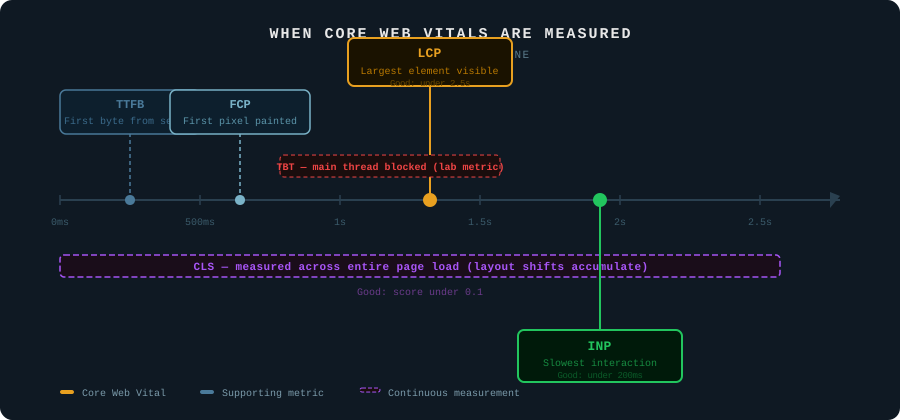
The diagram above shows a typical page load. Each metric is measured at a different point — which is why fixing one doesn’t automatically fix the others.
LCP — Largest Contentful Paint
What it is. The time from when the page starts loading to when the largest visible element has fully rendered on screen.
The “largest element” is usually your hero image, a large heading, or a video poster. The browser identifies whichever element takes up the most space in the viewport and records when it becomes visible.
Why it matters. LCP is the closest thing to “when does the page feel loaded?” from a user’s perspective. A blank screen or a page with only a navigation bar doesn’t feel loaded even if the HTML arrived. LCP captures the moment the main content appears.
Thresholds:
| Rating | Score |
|---|---|
| Good | Under 2.5 seconds |
| Needs improvement | 2.5 s – 4.0 s |
| Poor | Over 4.0 seconds |
Common causes of poor LCP:
- A large unoptimised hero image (JPEG or PNG instead of WebP / AVIF).
- Render-blocking JavaScript delaying page paint.
- Slow server response times pushing everything back.
- Hero image loaded lazily (it shouldn’t be —
loading="lazy"belongs on below-fold images only).
INP — Interaction to Next Paint
What it is. The time between a user interacting with the page — clicking a button, tapping a link, pressing a key — and the browser visually responding to that interaction. INP records the slowest such interaction across the entire page visit and uses that as the score.
Important: INP replaced FID (First Input Delay) as a Core Web Vital in March 2024. FID only measured the delay before the browser started processing an interaction. INP measures the full delay until the browser paints the response. Stricter, more meaningful.
Why it matters. A page can look loaded but feel broken if clicking buttons produces no visible response for several hundred milliseconds. INP captures that sluggishness — it’s the metric most closely tied to “does this page feel responsive?”
Thresholds:
| Rating | Score |
|---|---|
| Good | Under 200 ms |
| Needs improvement | 200 ms – 500 ms |
| Poor | Over 500 ms |
Common causes of poor INP:
- Heavy JavaScript executing on the main thread, blocking responses.
- Third-party scripts competing for main thread time.
- Poorly optimised event handlers doing too much work on click.
- Large DOM trees slowing down rendering after an interaction.
CLS — Cumulative Layout Shift
What it is. A measure of how much the page layout unexpectedly shifts during loading. If an image loads without dimensions and pushes your text down, that’s a layout shift. If a cookie banner appears and shoves the content below it, that’s a layout shift. CLS adds up all unexpected shifts across the page load and produces a score.
Unlike LCP and INP, CLS is not a time measurement — it’s a score calculated from the size and distance of layout shifts.
Why it matters. Layout shift is one of the most frustrating user experiences on the web. You go to click a link, the page shifts, and you click the wrong thing. CLS quantifies this and holds sites accountable for it.
Thresholds:
| Rating | Score |
|---|---|
| Good | Under 0.1 |
| Needs improvement | 0.1 – 0.25 |
| Poor | Over 0.25 |
Common causes of poor CLS:
- Images without
widthandheightattributes — the browser can’t reserve space. - Ads, embeds, or iframes with no declared dimensions.
- Web fonts causing text to reflow when they load (FOUT).
- Content injected above existing content after load (banners, cookie notices).
Supporting metrics
These don’t directly affect your Google ranking but they’re essential for diagnosing why your Core Web Vitals are poor.
TTFB — Time to First Byte
What it is. The time from the browser making an HTTP request to receiving the first byte of a response from the server.
TTFB is almost entirely a server-side metric. It reflects your hosting performance, server processing time, and whether caching is working. If TTFB is slow, everything else on the page is delayed before it even starts.
Thresholds:
| Rating | Score |
|---|---|
| Good | Under 800 ms |
| Needs improvement | 800 ms – 1800 ms |
| Poor | Over 1800 ms |
Common causes of poor TTFB:
- Slow shared hosting with no caching.
- Database queries running on every page load.
- No server-side caching (page cache, object cache).
- Geographical distance between server and user — a US server serving Irish visitors.
FCP — First Contentful Paint
What it is. The time from page load start to when any content — text, an image, a logo — first appears on screen. FCP is the moment the blank white screen ends.
FCP is earlier than LCP. FCP fires when something appears; LCP fires when the main content appears. A site might have a fast FCP (the navigation renders quickly) but a slow LCP (the hero image takes another two seconds).
Thresholds:
| Rating | Score |
|---|---|
| Good | Under 1.8 seconds |
| Needs improvement | 1.8 s – 3.0 s |
| Poor | Over 3.0 seconds |
TBT — Total Blocking Time
What it is. The total time the main thread was blocked by JavaScript for longer than 50 ms during the period between FCP and Time to Interactive. Any JavaScript task running for more than 50 ms is a “long task” — the excess time over 50 ms is counted as blocking time, and TBT is the sum of all that excess.
TBT is a lab metric only — it’s measured in controlled conditions (PageSpeed Insights, Lighthouse) rather than from real user data. It doesn’t appear in Google Search Console or the Chrome User Experience Report, but it’s highly correlated with poor INP.
If TBT is high, INP is probably poor too. Fix TBT and INP tends to follow.
Thresholds:
| Rating | Score |
|---|---|
| Good | Under 200 ms |
| Needs improvement | 200 ms – 600 ms |
| Poor | Over 600 ms |
Field data vs lab data
You’ll see this distinction in PageSpeed Insights reports and it’s worth understanding.
Lab data is measured in a controlled environment — Lighthouse running on Google’s servers simulating a mid-range Android device on a 4G connection. Consistent and reproducible, but a simulation. TBT is a lab metric.
Field data (also called CrUX data — Chrome User Experience Report) is collected from real Chrome users visiting your site over the past 28 days. LCP, INP, and CLS are field metrics. They reflect what your actual visitors experience.
Field data is what Google uses for ranking. Lab data is for diagnosis.
If your site is new or low-traffic, PageSpeed Insights may show no field data — you haven’t had enough real visitors for Google to collect a meaningful sample. In that case, lab data is all you have to work with.
Where to check your scores
PageSpeed Insights (pagespeed.web.dev) — run any URL. Shows both lab and field data. No account needed. The first place to check.
Google Search Console → Core Web Vitals report — shows field data aggregated across your whole site, broken down by URL group. Flags URLs rated Poor or Needs Improvement. Requires Search Console access.
Chrome DevTools → Lighthouse tab — run lab audits locally. Useful for testing changes before deploying. Shows the same metrics as PageSpeed Insights but on your machine.
WebPageTest (webpagetest.org) — more detailed than PSI. Run from a Dublin or Frankfurt node for EU-relevant results. Waterfall charts help pinpoint exactly which resource is causing the delay.
Chrome User Experience Report (CrUX) — the raw dataset Google collects from Chrome users. Accessible via BigQuery (free tier) or the CrUX API. Useful for bulk analysis across many URLs.
Reading a PageSpeed Insights report
When you open a PSI report, the structure is:
- Field data — real user data for the past 28 days. This is your actual ranking signal.
- Lab data — Lighthouse simulation. Used for diagnosis.
- Opportunities — specific suggestions with estimated time savings.
- Diagnostics — additional detail on what’s slowing the page down.
- Passed audits — things that are already fine, collapsed by default.
Focus on the field data Core Web Vitals first. Then use the lab data opportunities and diagnostics to understand what to fix.
A green score doesn’t guarantee top rankings — Core Web Vitals are one of many ranking signals. But a red score is a confirmed negative signal, and fixing it removes a penalty rather than adding a bonus.
Summary
| Metric | Type | Measures | Good threshold | Ranking signal |
|---|---|---|---|---|
| LCP | Field | Loading | Under 2.5 s | Yes |
| INP | Field | Interactivity | Under 200 ms | Yes |
| CLS | Field | Visual stability | Under 0.1 | Yes |
| TTFB | Field | Server response | Under 800 ms | No (diagnostic) |
| FCP | Field | First paint | Under 1.8 s | No (diagnostic) |
| TBT | Lab | Main thread blocking | Under 200 ms | No (diagnostic) |
Now you know what PageSpeed Insights is actually measuring. The next step is fixing it — and most of the fixes are free. See How to make your website faster without buying anything for a checklist covering images, scripts, caching, compression, fonts, and server-level hardening.
INP replaced FID as a Core Web Vital in March 2024. If you’re reading older guides that reference FID (First Input Delay), they’re out of date on this point.